Common method evaluation strategy#
Visual Summary of Prediction Outcomes and Statistical Error Rates#
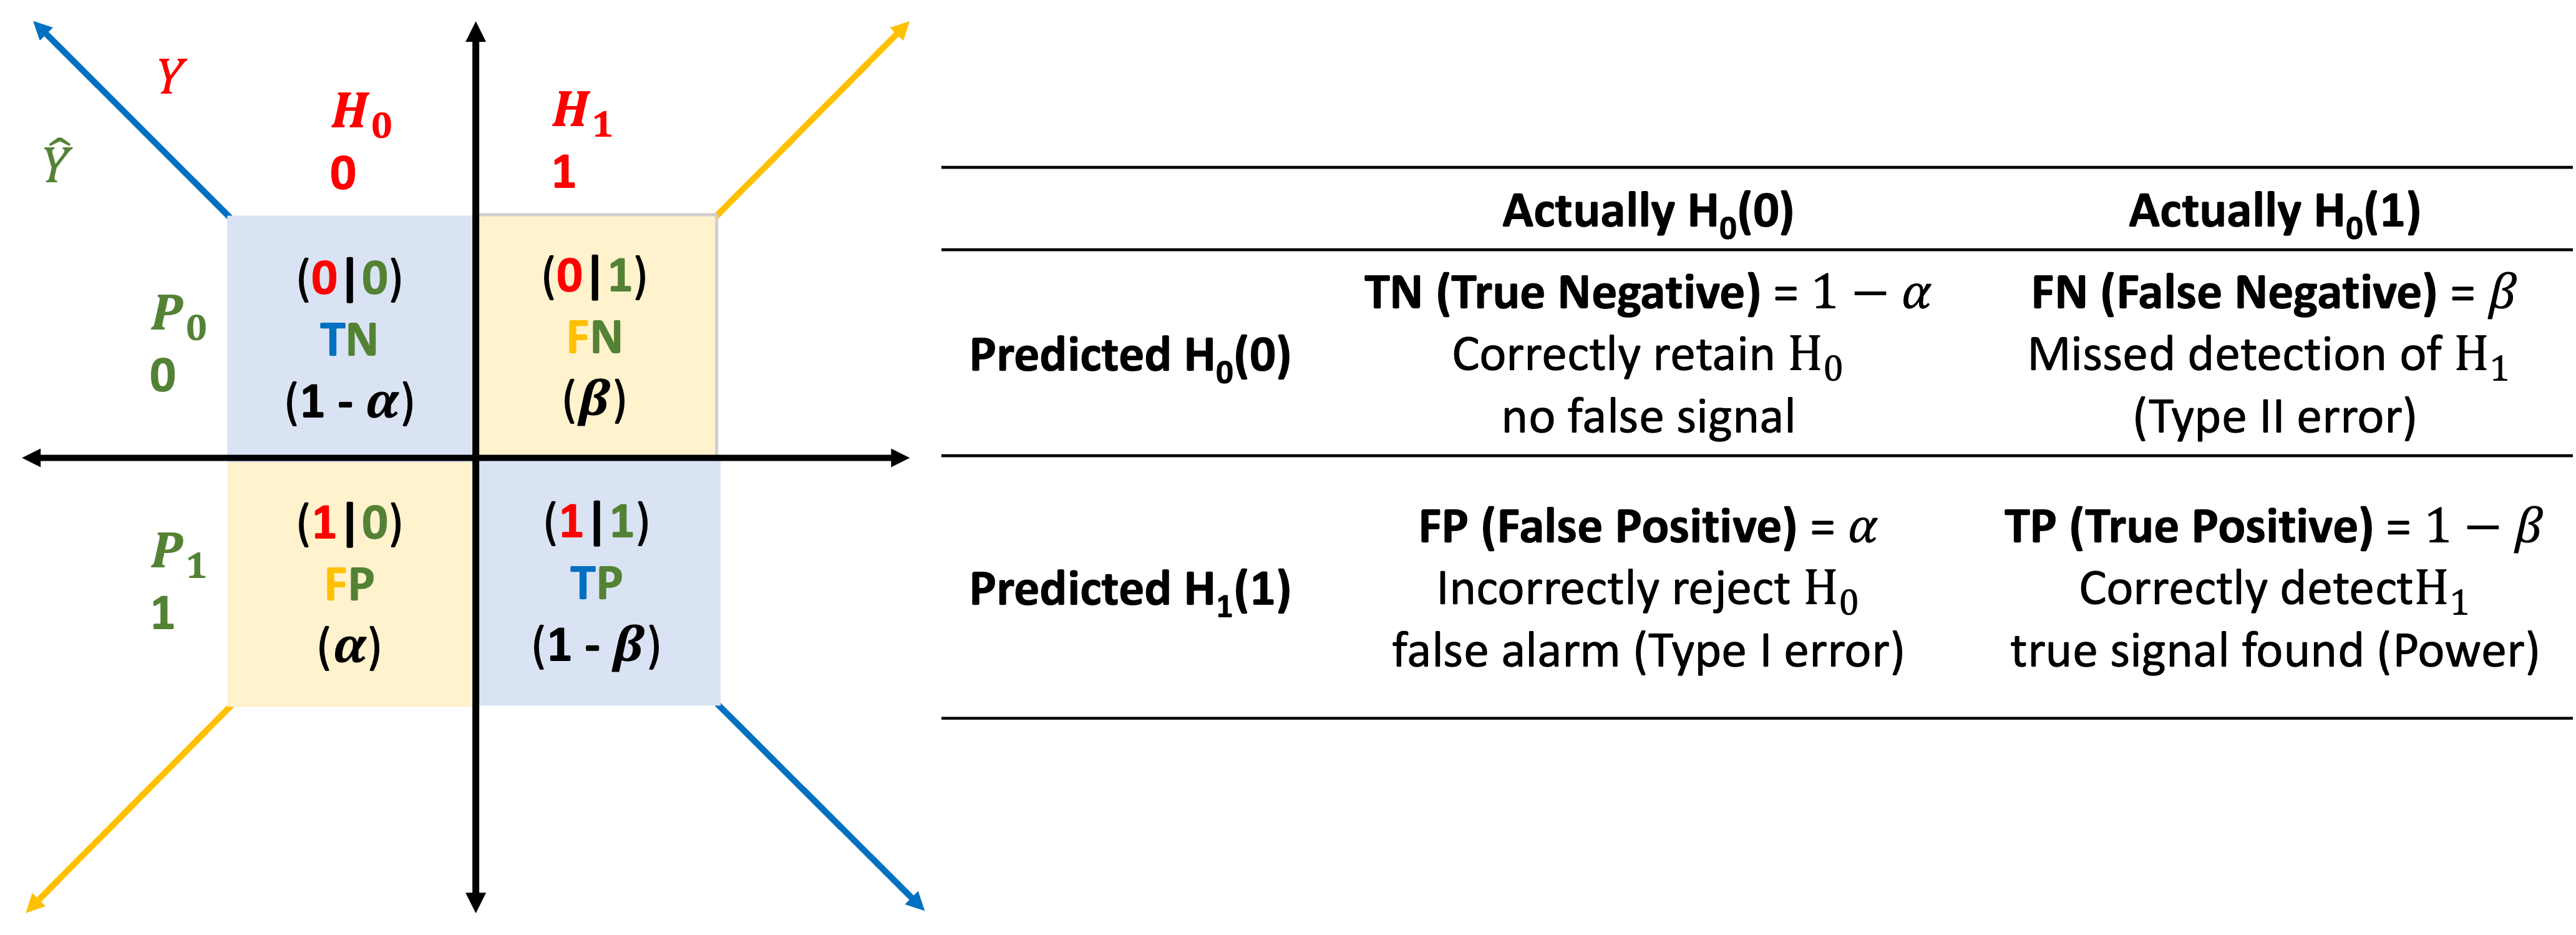
This matrix maps the relationship between predicted class \(\hat{Y}\)
and actual hypothesis \(H_0/H_1\),
with corresponding error rates and outcome labels:
TN (True Negative): \((0|0)\) → Correct rejection of \(H_0\)
FP (False Positive): \((1|0)\) → Type I error (\(\alpha\))
FN (False Negative): \((0|1)\) → Type II error (\(\beta\))
TP (True Positive): \((1|1)\) → Correct detection of \(H_1\)
Confusion Matrix Evaluation Metrics#
Metric Name |
Formula |
Interpretation |
Hypothesis Testing |
|---|---|---|---|
1. True Positive Rate (TPR) |
\(TPR = \frac{TP}{TP + FN}\) |
Probability of detecting a true alternative \((H_1)\) |
Equivalent to Power |
2. False Negative Rate (FNR) |
\(FNR = \frac{FN}{TP + FN}\) |
Missed detection: actual \((H_1)\), but predicted \((H_0)\) |
Type II Error Rate |
3. False Positive Rate (FPR) |
\(FPR = \frac{FP}{FP + TN}\) |
False alarm: actual \((H_0)\), but predicted \((H_1)\) |
Type I Error Rate |
4. True Negative Rate (TNR) |
\(TNR = \frac{TN}{TN + FP}\) |
Probability of correctly retaining \((H_0)\) |
Complement of Type I error |
5. Precision (PPV) |
\(PPV = \frac{TP}{TP + FP}\) |
Among predicted \((H_1)\), how many are truly \((H_1)\) |
Trust in detected signals |
6. Negative Predictive Value (NPV) |
\(NPV = \frac{TN}{TN + FN}\) |
Among predicted \((H_0)\), how many are truly \((H_0)\) |
Trust in rejected signals |